Typhoon Podul (Gorio) 2025
Last Modified:
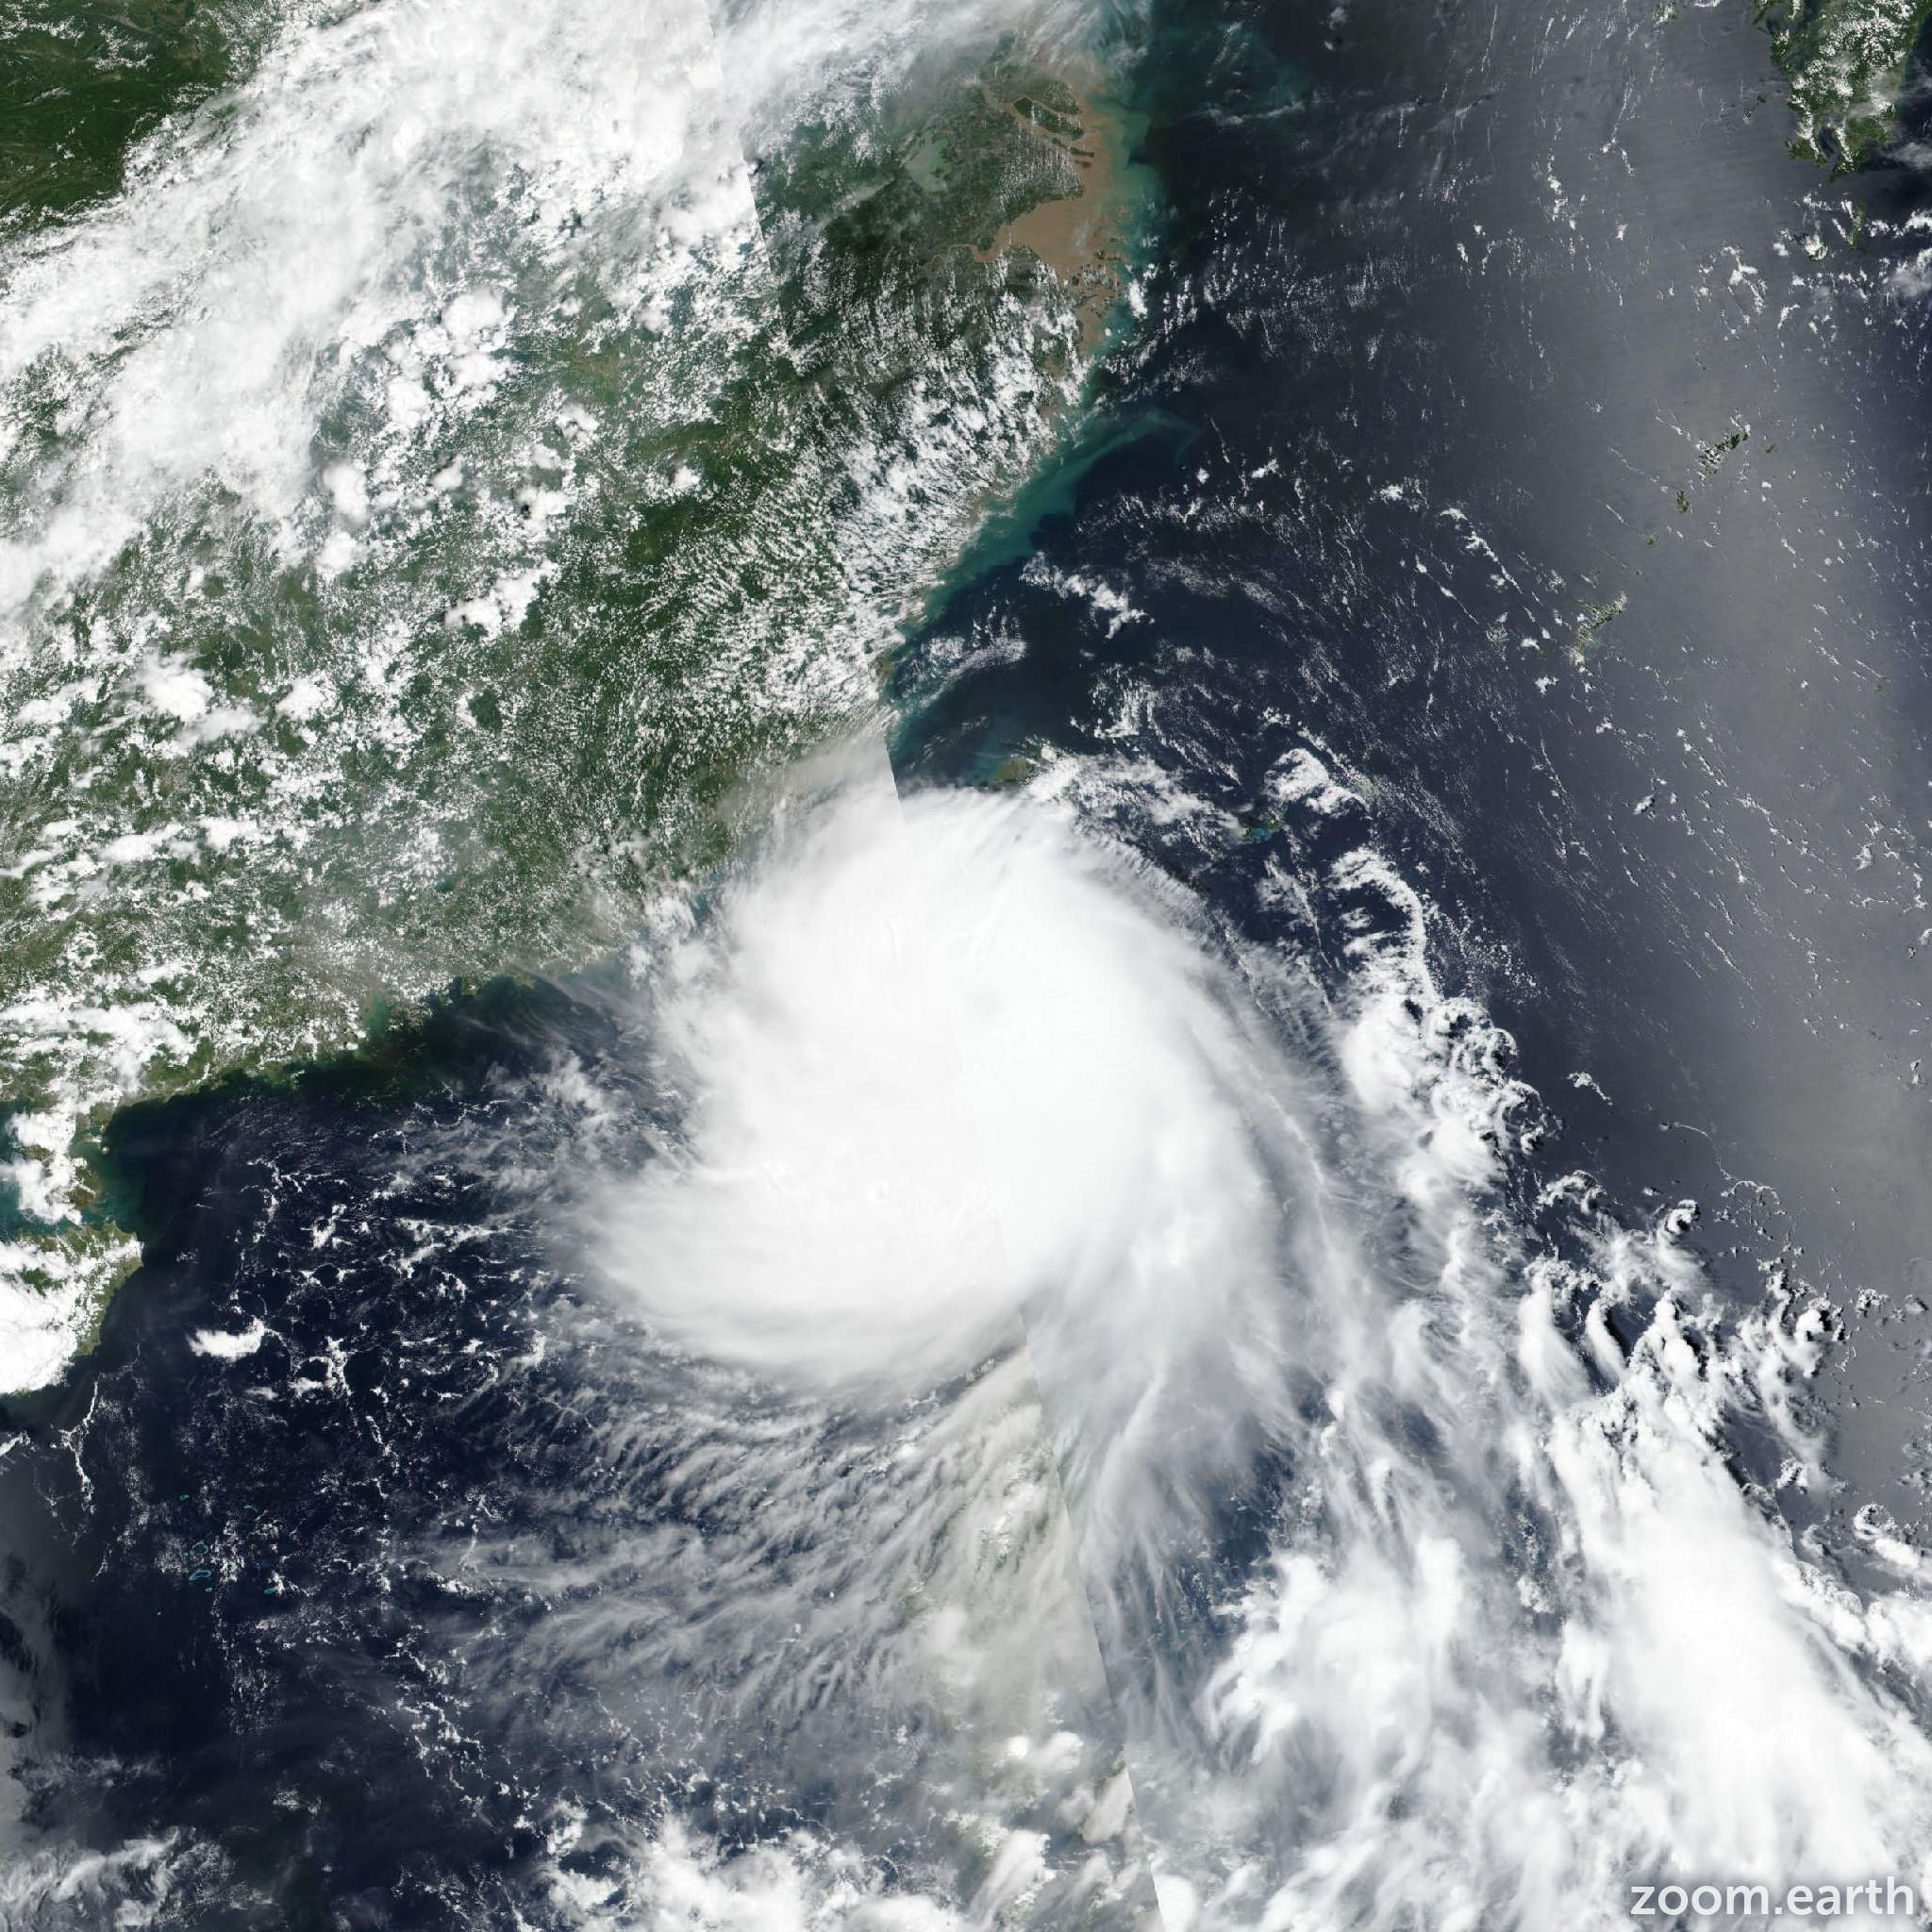
Satellite images, weather maps and tracks of Typhoon Podul 2025, 7 - 15 August. Max wind speed 165km/h.
Click on the map to add points. Double‑click to finish.
Tap on the map to add points.
Last Modified:
Satellite images, weather maps and tracks of Typhoon Podul 2025, 7 - 15 August. Max wind speed 165km/h.