Tropical Storm Mun 2025
Last Modified:
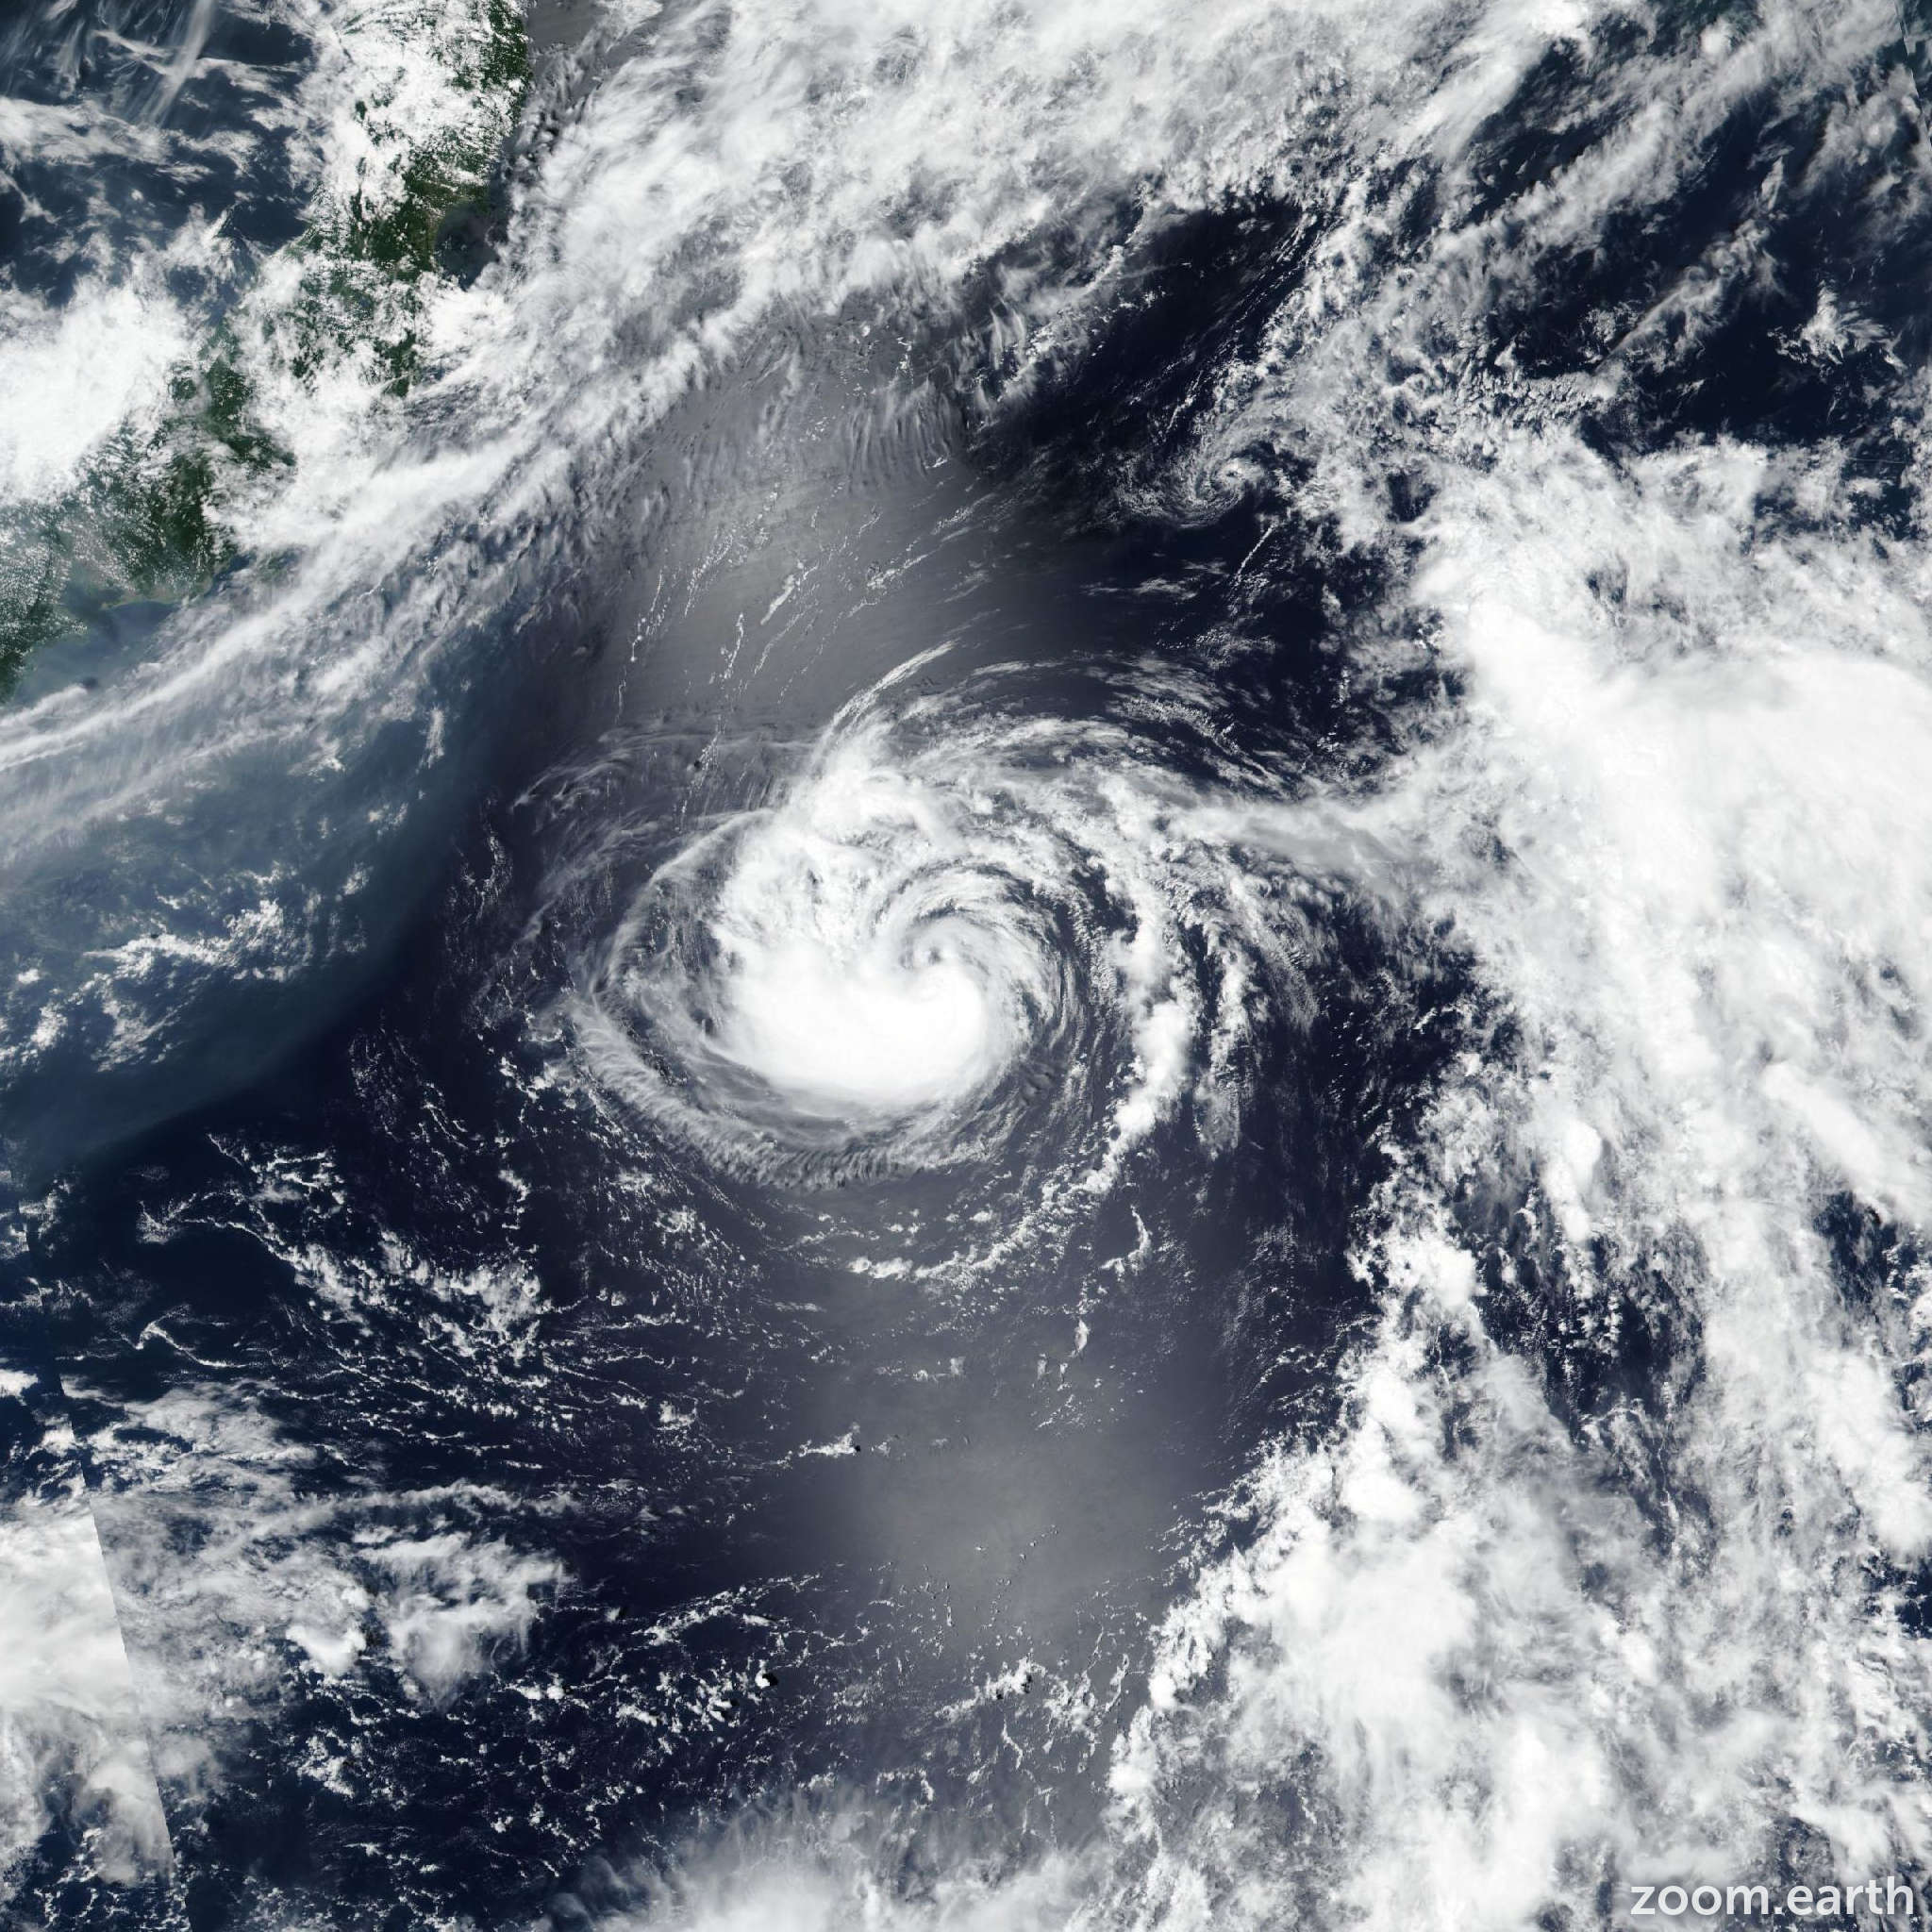
Satellite images, weather maps and tracks of Severe Tropical Storm Mun 2025, 1 - 8 July. Max wind speed 110km/h.
Click on the map to add points. Double‑click to finish.
Tap on the map to add points.
Last Modified:
Satellite images, weather maps and tracks of Severe Tropical Storm Mun 2025, 1 - 8 July. Max wind speed 110km/h.