Tropical Storm Jerry 2025
Last Modified:
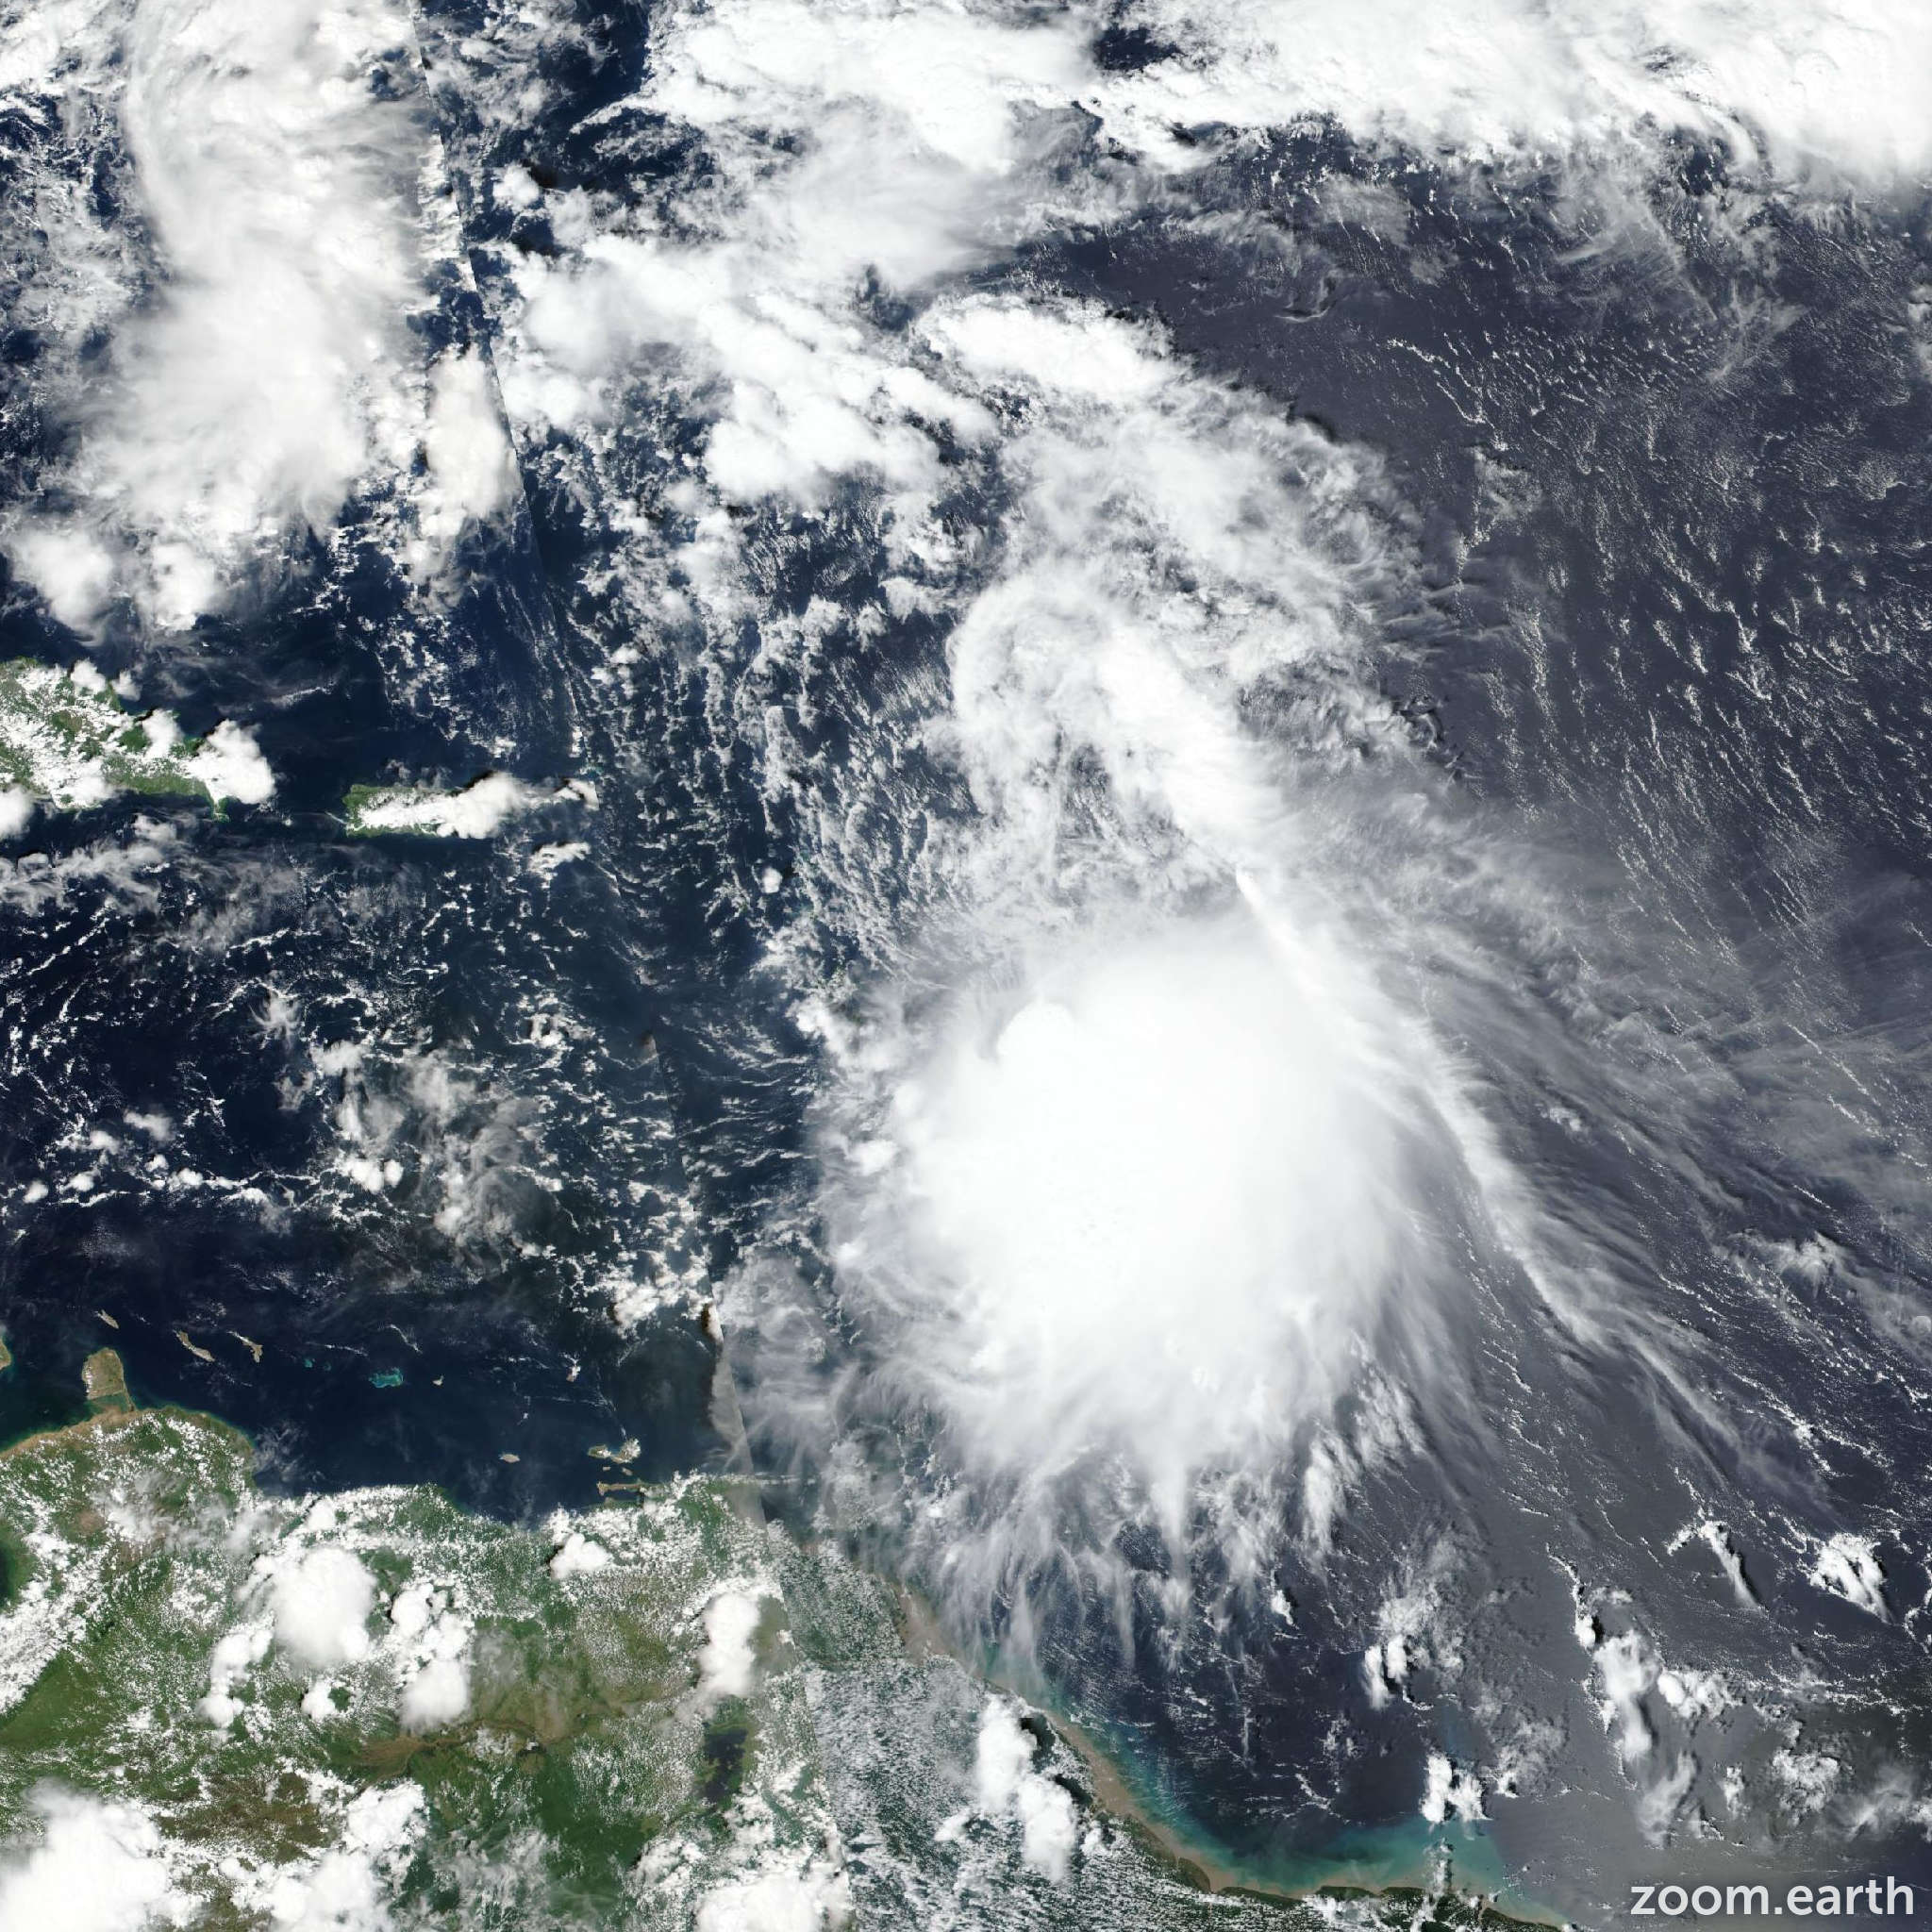
Satellite images, weather maps and tracks of Tropical Storm Jerry 2025, 7 - 11 October. Max wind speed 65mph.
Click on the map to add points. Double‑click to finish.
Tap on the map to add points.
Last Modified:
Satellite images, weather maps and tracks of Tropical Storm Jerry 2025, 7 - 11 October. Max wind speed 65mph.