Tropical Storm Choi-wan 2026
Last Modified:
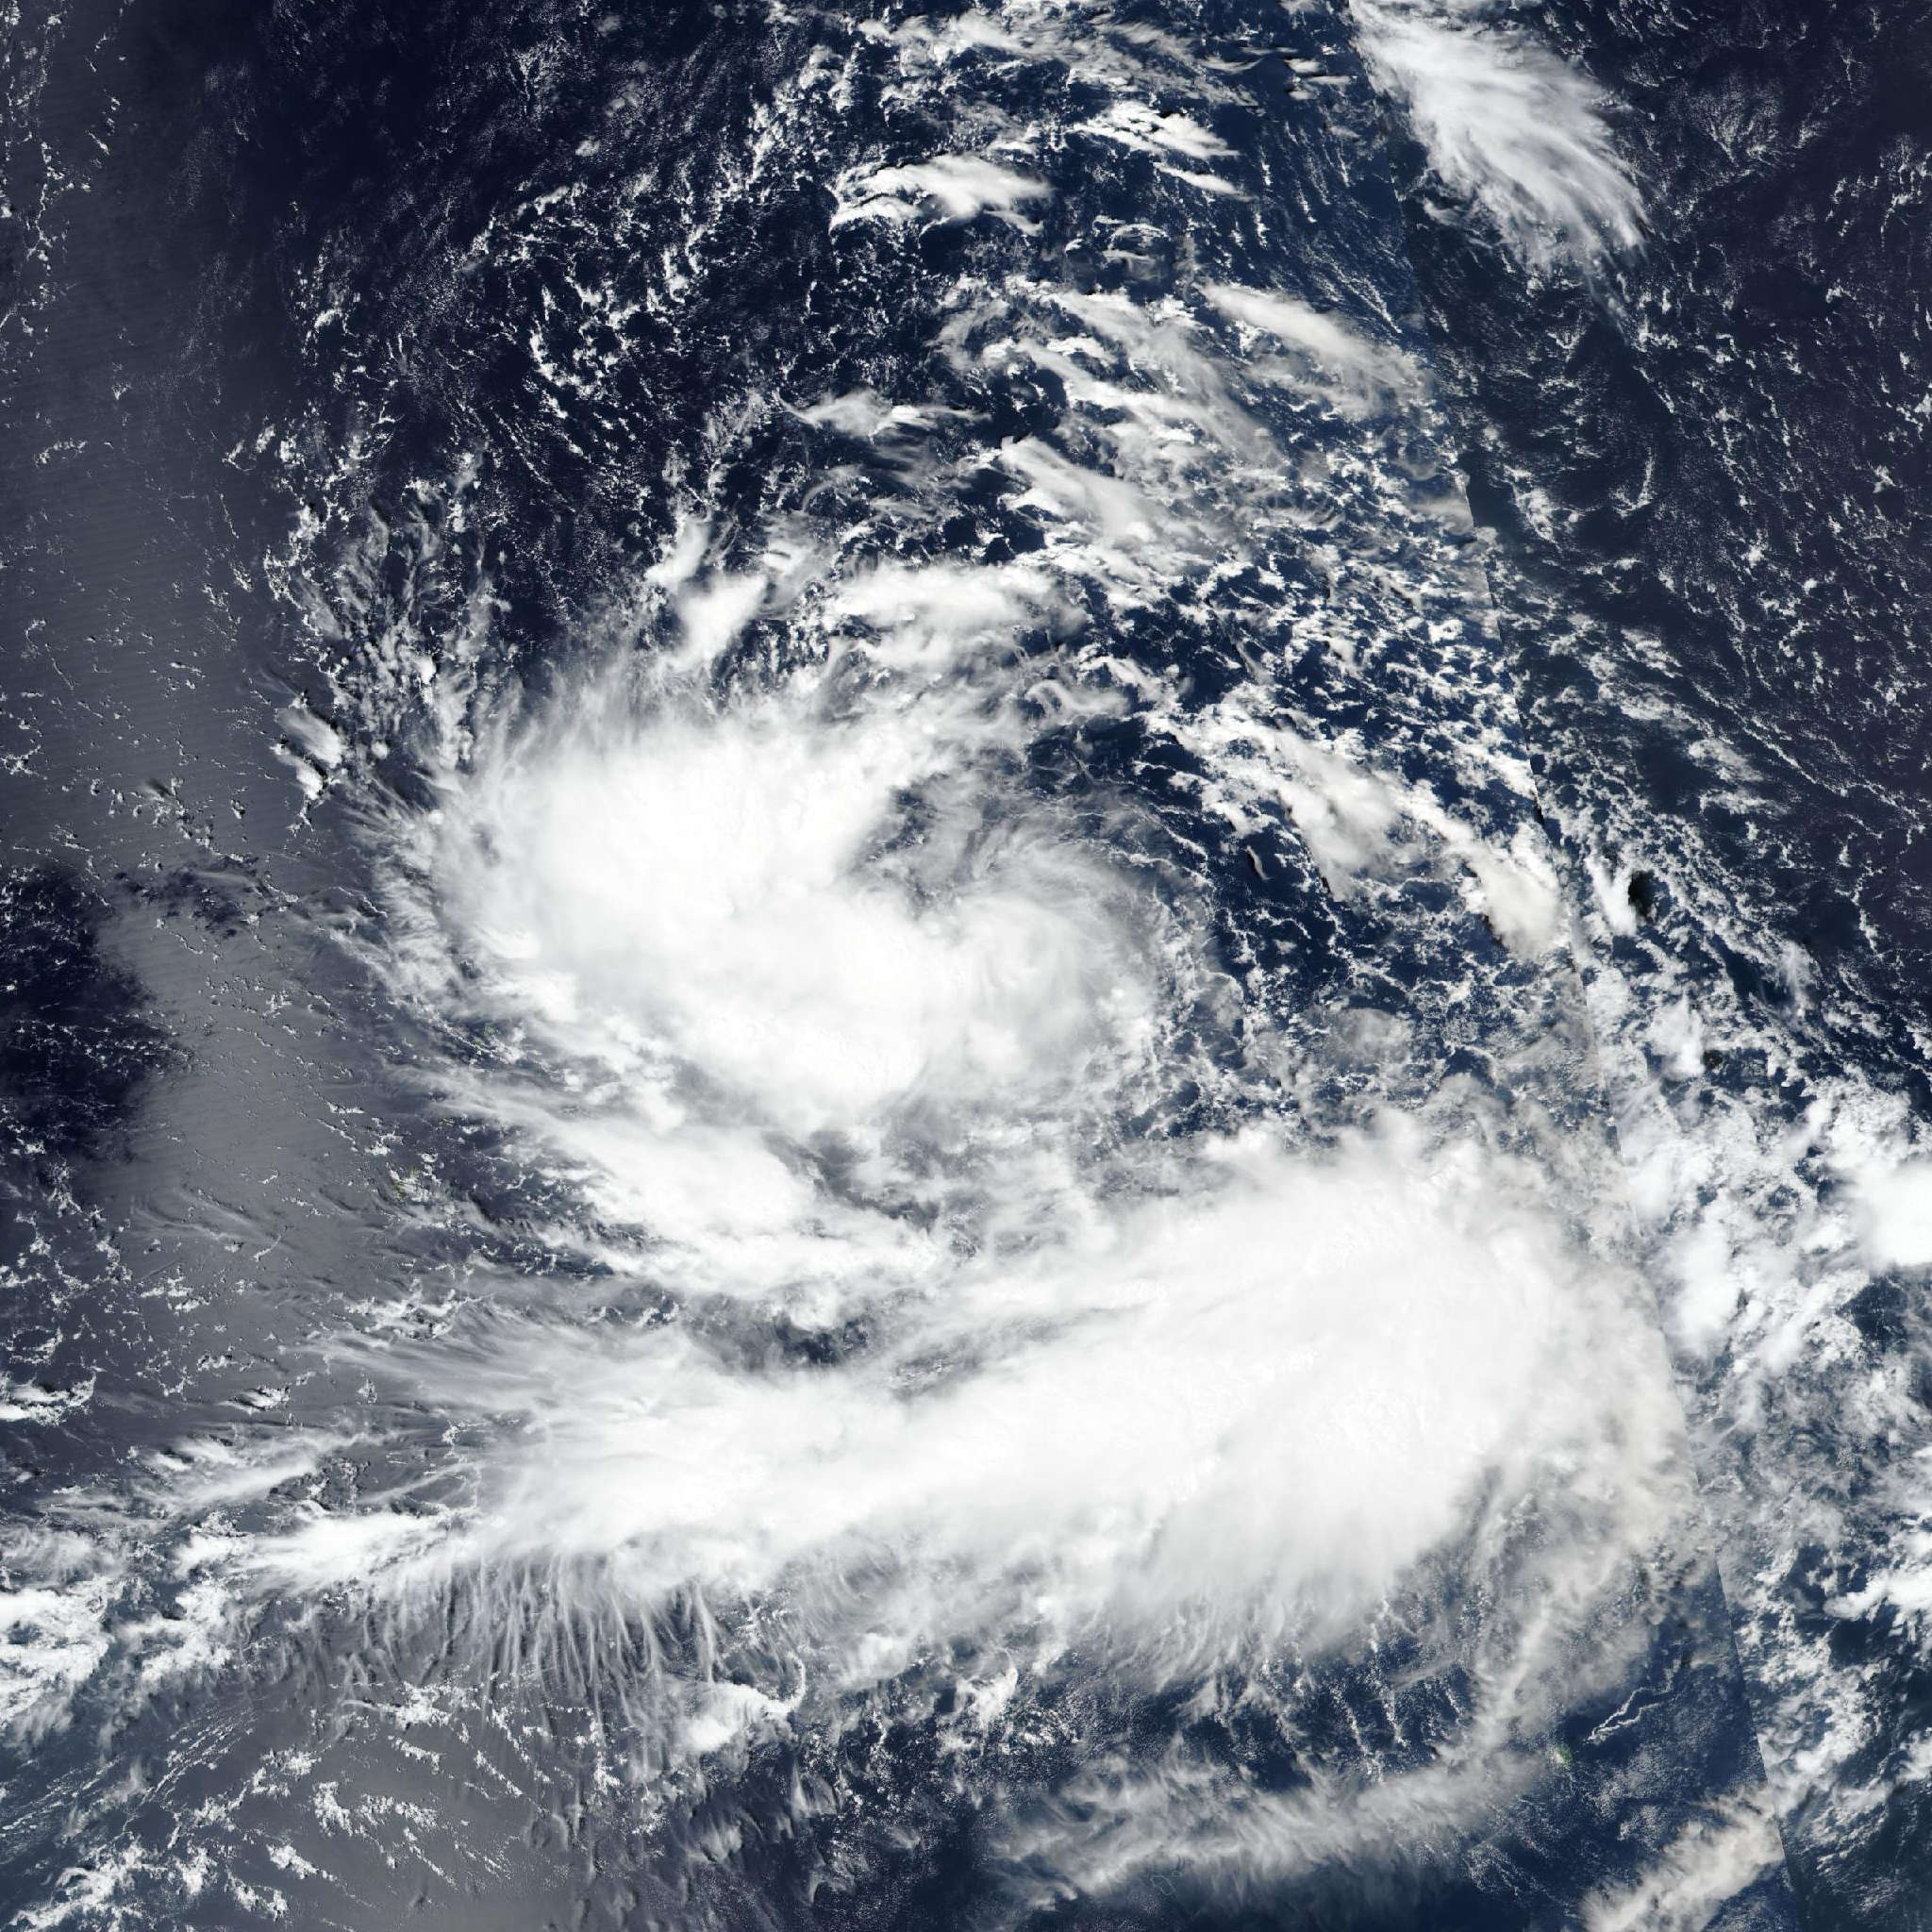
Live tracking map, satellite, radar, and forecasts of Tropical Storm Choi-wan 2026 (台風27号) near the Northern Mariana Islands. Current wind speed 65km/h. Max 205km/h.
Choi-wan is located 613 km east-northeast of Andersen Air Force Base, and has tracked west-northwestward at 15 km/h (8 knots) over the past 6 hours. Maximum significant wave height is 4.6 meters (15 feet).
Choi-wan is moving west-northwestward along the southern edge of a low- to mid-level subtropical ridge centered near 31N 169E. This motion will continue for the next 24 hours. After that time, a progressive shortwave trough racing downstream of northern Honshu and Hokkaido will erode the subtropical ridge.
The primary steering influence will weaken markedly, and Choi-wan will become nearly stationary. The system will then turn poleward in around 36 hours as the deep-layer subtropical ridge reorients, and the western flank of the ridge becomes the dominant steering mechanism.
Toward the end of the forecast period, the trajectory will nudge westward as the ridge builds slightly westward. The forecast calls for gradual to steady intensification for the first 24 hours, giving time for the storm to become vertically aligned and more symmetric.
After 24 hours, the persistent mid-level shear will ease. Coupled with very warm sea surface temperatures and very high ocean heat content, the lower shear and rich deep-layer moisture will enable Choi-wan to undergo significant intensification.
In 3 to 4 days, the system will move over lower ocean heat content, which will limit continued intensification. The progressively cooler sea surface temperatures and lower ocean heat content will become increasingly unfavorable for maintaining peak intensity, leading to gradual weakening after 4 days.
The low-level circulation associated with Choi-wan is large. The wind field will expand through the majority of the forecast period, with impacts extending far from the center.
The JTWC forecast track has changed very little this cycle. Track guidance is coming into better agreement on the location and timing of the poleward turn, with dynamical models generally shifting westward and the AI models shifting eastward toward a common solution.
At the point of recurvature, the spatial spread among the guidance is approximately 232 km. NAVGEM and HAFS-A are fastest in depicting the poleward turn, likely attributed to their tendency to simulate stronger convective feedbacks.
ECMWF and Google DeepMind are the westernmost solutions, delaying the turn by 6 to 12 hours relative to the AI consensus. The forecast track is positioned near the mean of the AI models over the next 5 days with medium confidence, which is now only 93 km west of the JTWC consensus tracker (CONW) at 60 hours.
Subsequent forecasts retain some flexibility to shift the track slightly farther south and west before the sharp poleward turn. Multiple rapid intensification (RI) aids have triggered this cycle.
SHIPS shows a 48% probability of a 65-knots increase in the next 3 days. Google DeepMind also predicts significant intensification. Given the model support and favorable environment ahead of the storm, the forecast calls for RI to commence after 24 hours.
The JTWC intensity forecast is set at the upper end of the guidance envelope with medium confidence, lying closest to the DeepMind solution.